A Comprehensive Guide to Frontend Error Handling: From UI Layer to Monitoring
Introduction
In software projects, error handling is a crucial component that covers a wide range of areas, and different product types require different error handling and monitoring approaches. This article focuses on "frontend error handling mechanisms," with an emphasis on "general" concepts and brief implementations applicable to various types of products.
In previous projects, I've worked on optimizing frontend error handling, including error displays, error logging, and error monitoring, to help identify and fix problems more quickly when errors occur. Recently, I wanted to organize an overview of frontend error handling, so I'm sharing this to help those who need it.
Basically, the goals we want to achieve with "frontend error handling mechanisms" are:
- When users actively provide error screenshots, development teams can repair issues more efficiently => corresponds to error displays
- When users only provide the time of an error, development teams can obtain more information to begin repairs => corresponds to error logging
- When users encounter errors, even without actively notifying, development teams can begin repairs themselves => corresponds to error monitoring
This article is divided into the following sections:
- Overview of Frontend Error Handling Systems
- Error Display Processing
- Error Logging Processing
- Error Monitoring Processing
- Key Points and Review
In the chapters on error displays, logging, and monitoring, I'll include detailed "concept explanations" and simple "implementation summaries."
Regarding implementation summaries, the code will only demonstrate concepts, with most details omitted. The focus is on understanding why and how to implement, rather than providing step-by-step instructions. As for technical tools, I'll use Next.js, GCP Logging/Monitoring, and Slack for examples, but these are simple universal concepts that should be understandable even if you're not familiar with these specific tools. Of course, you can implement the same concepts using other technical tools.
Additionally, there are many types of errors in web applications which I won't introduce in detail. I'll directly use "Unexpected errors" caught by "React error boundary" as an example, but the implementation concepts can be applied to different error types.
I've titled this "A Brief Discussion" because I consider the content relatively elementary, more suitable for "frontend engineers who haven't yet implemented error handling and monitoring." If you already know how to catch errors for display, send errors to logs, and send error alerts to Slack, you probably don't need to read this.
I believe that after understanding this article, it will expand your breadth of frontend knowledge and help you understand the global perspective, though the technical depth is not extensive.
In summary, after reading this article, you should be able to:
Understand the basic frontend error handling and monitoring mechanism overview, and generally understand how to implement it.
Overview of Frontend Error Handling Systems
When thinking about frontend error handling, the intuitive response is often just the "error display" shown when an error occurs. However, considering only this aspect limits us to a single-point perspective rather than a global view. Beyond displays, there should at least be "error logging" and "error monitoring" setups to make the error handling process system more complete and improve debugging efficiency.
Technical implementations usually have underlying reasons, so let's discuss why we need "error displays," "error logging," and "error monitoring."
Why We Need Error Displays
If there's no error display when an error occurs, two situations arise:
- Users encountering functional problems have no idea what's happening or what to do
- Users wanting to report problems can't provide any meaningful screenshots
Therefore, displaying well-designed error screens when users encounter errors not only improves user experience but also includes information that helps developers identify, find, and solve problems more quickly after seeing error screenshots.
A good error display lets users know what to do next after seeing it; lets developers gain initial debugging information after seeing it.
Why We Need Error Logging
What if users don't even provide a screenshot, but only the time when the error occurred?
What if the error is related to the user's device or browser version, which can't be seen from a screenshot and is difficult to inquire about further from users?
In these cases, if detailed information needed for error investigation is recorded somewhere when an error occurs, this problem can be solved. Even if users only provide the time of the error, developers can use that time to look up detailed error information, thus inferring the cause of the error or recreating the error scenario, and then fixing it.
This recorded information is usually called a "Log." Most companies send logs to third-party services for storage, such as Sentry or Cloud Logging. Besides not having to maintain storage points, these services typically include good query functionality, allowing you to quickly find the error logs you want to view among large volumes of logs.
Good error logging allows developers to quickly query error details needed to solve problems.
p.s.1 Although using third-party services doesn't require maintenance, they usually cost money, so consider cost issues, especially when log volumes are large.
p.s.2 When sending logs, avoid recording sensitive information, otherwise there will be security issues. I'll discuss this more in the error logging section below.
Why We Need Error Monitoring
Wouldn't it be more efficient if developers discovered and started handling or even fixing problems before users actively reported them?
Wouldn't it be better if product managers knew about issues and prepared comprehensive explanations for customers before they reported errors, making it seem like everything is under control?
All these can be achieved by setting up error monitoring alerts when errors occur. When errors are sent to third-party services, you can set up alerts for specific error conditions, sending notifications to Slack, Email, etc., to notify the team. This allows the team to check and handle error logs earlier, without waiting for users to report problems.
These types of error monitoring mechanisms can usually be set up in third-party services such as Sentry and Cloud Monitoring.
By the way, error logging and monitoring can be set up not only on Production sites but also on Staging/Dev sites. The advantage is that if error alerts appear when releasing features to Staging/Dev sites, you can fix them immediately, ensuring that real users on Production sites won't encounter these errors.
Good error monitoring transforms passive reactions into proactive responses, allowing teams to handle errors earlier.
Why "Frontend" Needs to Focus on Error Handling
I believe software products are the responsibility of teams, so regardless of function within the team, everyone needs to care about the product's error status. However, each role focuses on different aspects, and as frontend engineers, we particularly need to focus on:
- Some errors occur in frontend code, such as: frontend component Unexpected errors (possibly due to incorrect API runtime data formats, certain APIs not supporting specific browser versions, etc.)
- Some client-side information can be recorded by the frontend, such as: the page URL where users encounter errors, detailed device information, frontend APP version numbers, etc. Having this information can solve some errors more quickly.
- What information should error displays include to improve user experience and make error resolution more efficient for developers is part of the frontend error handling system.
From a product perspective, consider several questions to determine if error handling is done well:
- How can users know what happened and what they can do after encountering an error?
- How can teams effectively handle problems when users only provide error time or screenshots?
- How can warning notifications be received when errors occur, so teams can begin handling them before users actively report them?
These questions can be more efficiently resolved with frontend roles involved in the error handling mechanism.
The Complete Picture of Frontend Error Handling Mechanisms
Combining the "error displays, logging, monitoring" mentioned above, we can roughly use the following diagram to illustrate the concept of frontend error handling mechanisms:
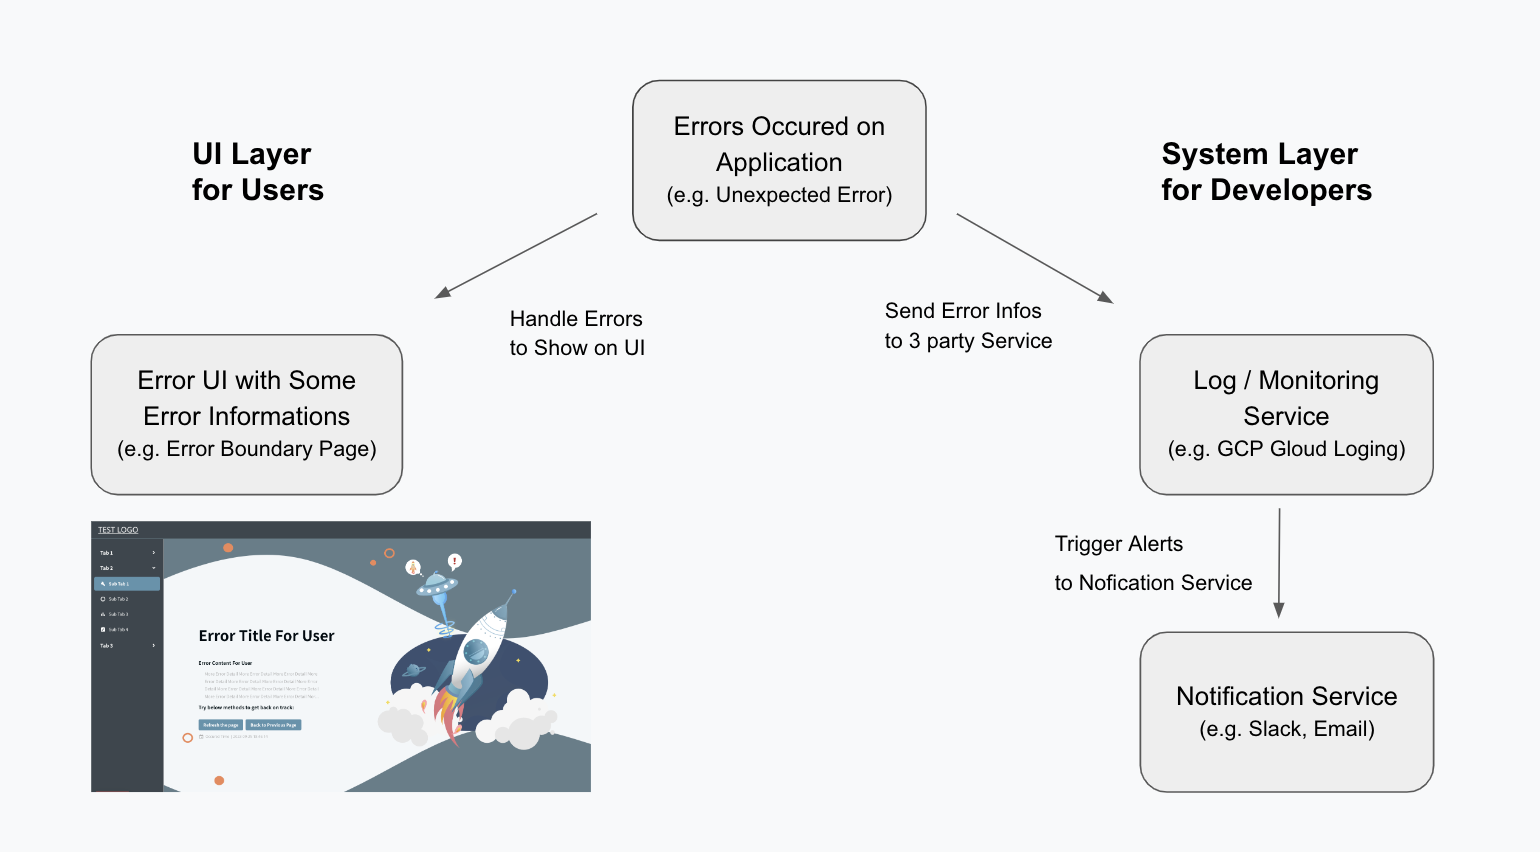
The left UI Layer shows error displays for users; the right System Layer includes error logging and monitoring, providing tools for developers.
When an error occurs, users see the error display; developers receive error warnings and can further query error logs to get more information needed for debugging.
These three items are related but don't all have to be implemented at once.
In real situations, teams consider time, human resources, etc., and often don't perfect everything at the beginning—nor is it necessary. For example, a startup product whose sunset date is uncertain doesn't need to immediately allocate resources to perfect everything. However, in stable, profitable, and mature products, efforts are usually made to perfect all three.
Next, I'll discuss what to pay attention to at each level—display, logging, and monitoring—and briefly implement them.
Display Level Processing
Concept Introduction
Display processing is part of the frontend's core job. Error displays need to address two key points:
- User Experience: Let users know what happened and what they can still do
- Developer Experience: Provide developers with preliminary debugging information
For user experience, you can design error "titles" and "content" to let users know what happened, and design operation "buttons" to intuitively show users what they can do.
If users provide error screen screenshots, what information on the screen can help developers query the issue? In fact, if the "error title or message" is designed, like corresponding to specific Error Codes, it can speed up queries.
But if "error logging" is implemented, having just the "error occurrence time" allows you to query the details of the error occurrence, thus more quickly inferring the cause of the problem and debugging.
Below are error display diagrams, focusing on information content—UI details and aesthetics can be ignored for now:
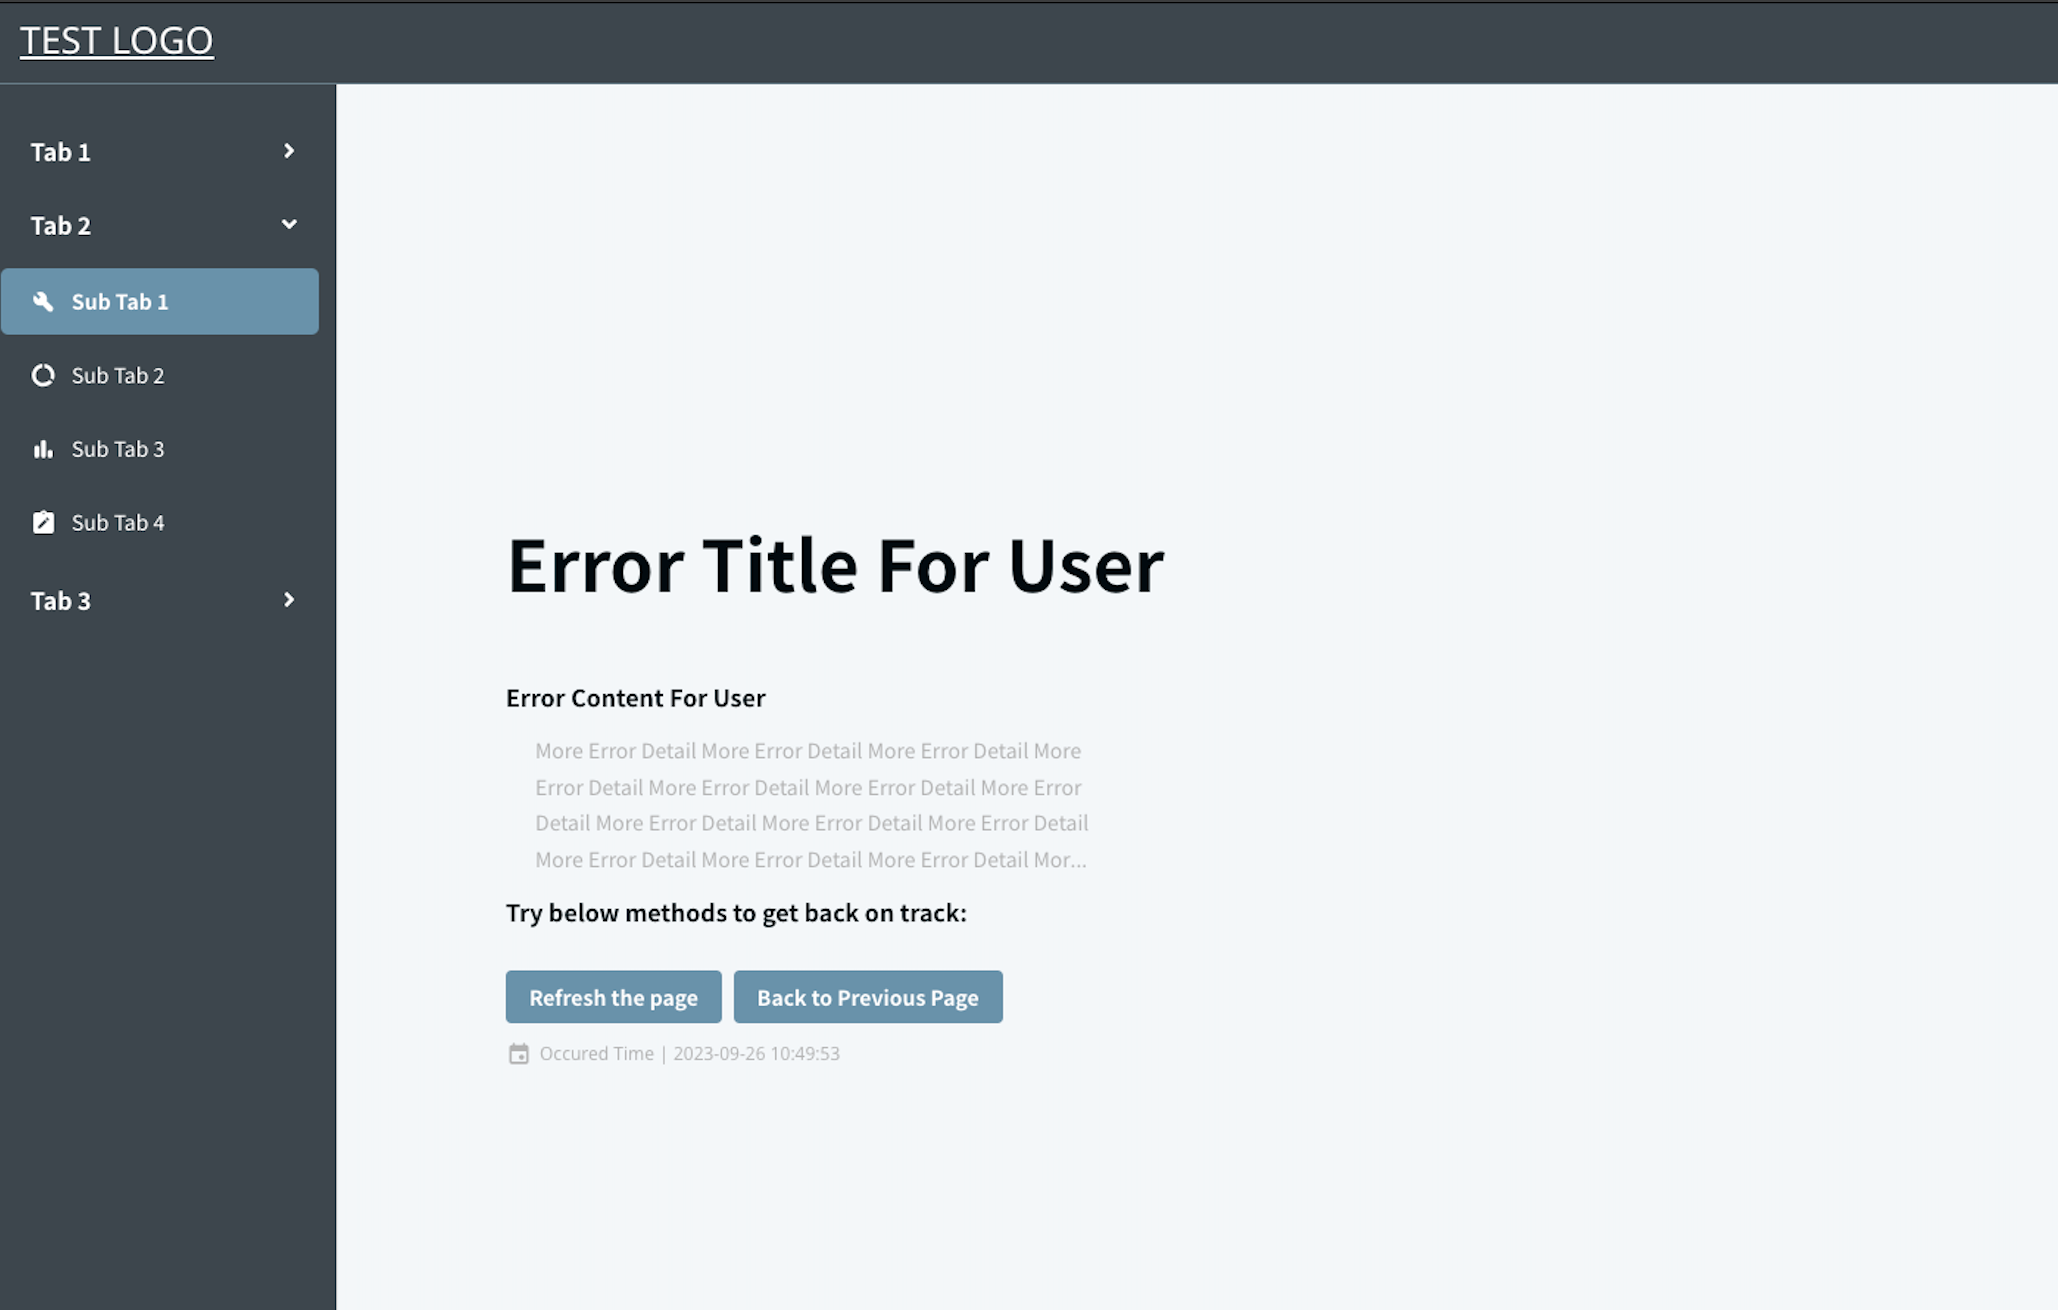 (Error Boundary Page example, with title, content, operation buttons, error time)
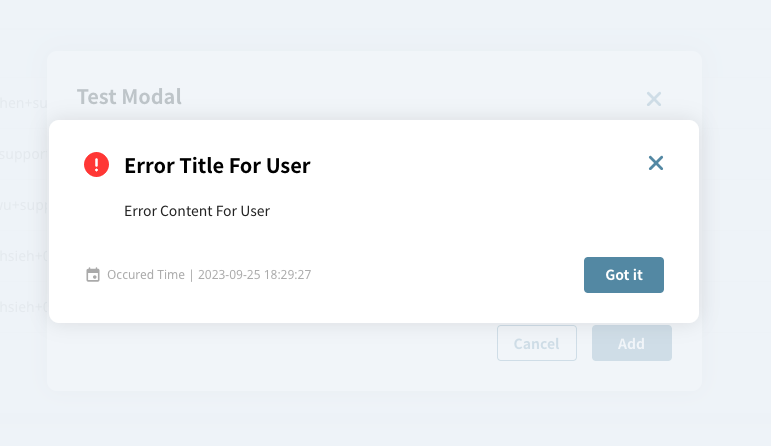 (Error Modal example, with title, content, operation buttons, error time)
Implementation Summary
When implementing error displays, there are two main tasks:
- Catch errors: Different error types have different catching methods, common ones include
try catch,window.onerror,addEventListener('error', function),error boundary, etc. - Display the screen: Use frontend languages or frameworks to display error screens showing error titles, content, time, and providing operation buttons for users.
This article demonstrates using React error boundary in a Next.js APP to catch Unexpected errors in components and display them on customized error screens.
p.s. All code implementations may vary depending on tool versions.
The first step is to create an ErrorBoundary class component:
/* ErrorBoundary.js file */
import ErrorFallback from './ErrorFallback'

class ErrorBoundary extends React.Component {
    constructor(props) {
        super(props);
        // Init state
        this.state = {
            hasError: false,
            error: null
        };
    }

    static getDerivedStateFromError(error) {
        // Update state so the next render will show the fallback UI.
        return { hasError: true, error };
    }

    componentDidCatch (error) {
        // You can catch unexpected error here and send log to your service.
        // This log system will be built in the next chapter.
    }

    render () {
        if (this.state.hasError) {
            // You can render any customized fallback UI.
            return (
                <ErrorFallback
                    // for showing error info.
                    error={this.state.error}
                    // for refreshing the page.
                    resetError={() => {
                        this.setState({
                            hasError: false,
                            error: null
                        });
                    }}
                />
            )
        }
        // If don't have error, then show original children component.
        return this.props.children
    }
}

export default ErrorBoundary
The ErrorFallback UI display depends on the product manager, designer, and frontend engineer's implementation decisions. For example, it could be:
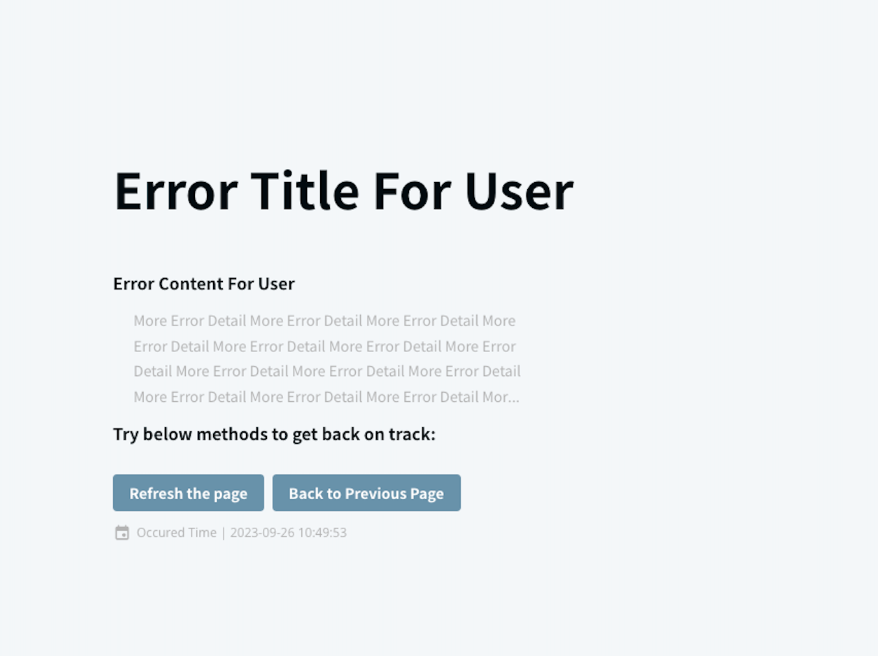 (Error Boundary Content example, with title, content, operation buttons, error time)
The key is that "users know what happened and what to do next" and "developers can obtain error information for further inquiry," regardless of how the display experience details and content are presented, which depends on the product type.
From the code, you can see that ErrorBoundary returns this.props.children when there's no error, meaning ErrorBoundary wraps around children components, leading to the second step.
The second step is to wrap the ErrorBoundary around the children components you want to protect.
In this article's example, we'll handle it directly in the _app.js file, so that "all pages" are protected. If an Unexpected error occurs on any page, the designed Error Boundary page will be displayed.
/* _app.js file */
import Layout from '@component/Layout'
import ErrorBoundary from '@component/ErrorBoundary'

// ...(omitted)

const MyApp = ({ Component, pageProps, ...... }) => {
  // ...(omitted)
  return (
    <Header>
        ......
    </Header>
    <Layout>
        {/* Use ErrorBoundary to wrap all app Component. */}
        <ErrorBoundary>
          <Component {...pageProps} />
        </ErrorBoundary>
    </Layout>
  )
}

// ...(omitted)
Because the implemented Layout includes Header and Sidebar:
/* Layout.js file */
import Header from '@component/Header'
import Sidebar from '@component/Sidebar'

// ...(omitted)

const Layout = ({ children }) => {
    return (
        <>
            ......
            <Header />
            <Sidebar />
            {children} // This chidren will wrap by our ErrorBoundary
            ......
        </>
    )
}

// ...(omitted)
So when an Unexpected error occurs, the display won't just be the ErrorBoundary screen, but Header + Sidebar + ErrorBoundary. This way, users can still click buttons on the Header or Sidebar to navigate to other pages that aren't broken, improving the experience.
(Error Boundary Page example, with Header and Sidebar available for operation besides the ErrorBoundary screen)
However, it's important to note that if an Unexpected error occurs in the Header or Sidebar, it won't be protected by the current ErrorBoundary design. You'll need to handle this separately, such as wrapping them with other Boundaries, which won't be elaborated on here.
Logging Level Processing
Concept Introduction
The logging level is about recording data at the moment an error occurs to facilitate subsequent queries.
What to record can be determined by the nature of the product. For example, if the product is just a website mostly used on Mac laptops, the device operating system might not be important. But if it's a PWA product installed on various devices and operating systems, recording the device and operating system becomes crucial.
Here are some data that "might" be recorded:
- Record frontend APP version:
- Explanation: Products usually update their version numbers after each release, and sometimes recording the version can quickly clarify issues.
- Example: When only some users encounter problems on the same page and functionality, you can first check which frontend version they're using from the error message. Perhaps users on a previous version are the only ones having issues.
- Record browser, device, operating system information:
- Explanation: If your product runs on multiple browsers, devices, and operating systems, recording this information becomes very important.
- Example: You discover many error logs, but your team hasn't encountered the issue. After detailed investigation of devices and operating systems, you find that the error only occurs on a specific operating system version where an API isn't supported yet.
- Record the current page URL:
- Explanation: Products usually have multiple pages, and sometimes recording the page path and query can quickly identify the problem.
- Example: When an Unexpected error page crash occurs, you can quickly determine which page is affected; you discover an API has issues on page A but not on page B, and it turns out there's a data format problem specific to page A.
- Record login-related information:
- Explanation: Products usually have login functionality, and sometimes recording user data or company data can help quickly identify issues. Need to be mindful of security concerns and avoid recording sensitive data.
- Example: Some users are missing an edit button, and you discover it's because users with a specific role have display issues; problems only occur for non-logged-in users on the same page, which is also apparent from the user data where non-logged-in users have empty IDs.
These are just some examples.
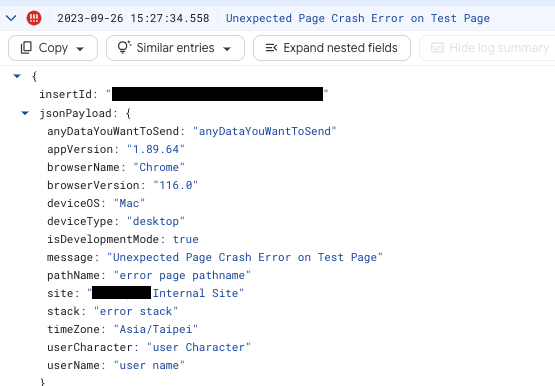
 (Example of a single log entry)
What data logs record is a "changing" process. You might initially record a lot, then find some isn't used and stop recording it; you might not record something initially, then discover during debugging that you need it and add it later. It's a process that can be continuously optimized.
However, more important than what to record is what must not be recorded:
You must not record security-sensitive data. For example: don't record user-input passwords, even incorrect ones, because having incorrect passwords makes it easier to infer the correct ones; don't record tokens, as accidental leaks can be serious; and so on. Basically, don't record anything you consider sensitive.
Don't think no one would make the mistake of putting passwords into logs. In the article Does it make sense to encrypt passwords when the frontend API calls? by Huli, he mentions another article The case for client-side hashing: logging passwords by mistake which states, "Some big players such as Facebook, Twitter and GitHub have published incidents where plaintext passwords are logged," with records of major companies sending passwords to log systems.
Implementation Summary
For error logging implementation, there are two main tasks:
- Encapsulate the method for sending logs: Different third-party services may have different implementation methods. You can refer directly to the APIs provided by the third-party service, such as: Sentry APIs, GCP Logging APIs
- Catch errors and send logs: Use methods like
try catch,Error Boundary, etc. to catch error information, organize it with other information to be sent (URLs, devices, operating systems, version numbers, etc.), and use the encapsulated method to send the data to the Log Service.
The first step basically involves following the API documentation provided by the third-party service, so we can skip that part XD. But if you happen to be using GCP Cloud Logging, you can use this as a reference.
As for why the team I was working with chose GCP Cloud Logging:
- Financial cost considerations: The company I was at was a Google partner, so we could use most GCP Cloud services at a very low cost.
- Technical cost considerations: The backend was already using GCP Cloud Logging, and other teams were also using GCP-related services, making it easier to manage with a unified technology stack.
So we chose GCP Cloud Logging, which I'll use for this simple demonstration.
When using GCP Cloud Logging, you need a Service account credential, which you can "imagine" as a very important private key file. The permissions for this key can be very broad, covering all GCP functions, or they can be limited to specific functions needed for this article, like Logging and Monitoring.
Since Service account credentials aren't the focus of this article, I won't elaborate further. If you're interested, you can check the Service account credentials document. The most important thing to know is: GCP strongly recommends including Service account credentials on the Server side when sending logs for security.
Since our frontend Next.js project had a Server configuration with low usage, we directly opened an /api/log API in the Server. This way, when frontend errors occur, they are first sent from the Client side to the Server through the /api/log API, and then from the Server with Service account credentials to the GCP Logging Service through the @google-cloud/logging API.
To summarize the flow:
- Client side catches an error =>
- Error information is organized and sent to the Server side via the
/api/logAPI => - Server side receives the error data =>
- Server side calls the
@google-cloud/loggingAPI to send to the GCP Logging Service
The conceptual implementation code is as follows:
/* server.js file */

// ...(omitted)

const express = require('express')
const next = require('next')
const { Logging } = require('@google-cloud/logging')

// For development mode, will set CREDENTIALS on server
// For production mode, will set CREDENTIALS during deploy step (not the focus of this article)
const isDevelopmentMode = process.env.NODE_ENV !== 'production'
if (isDevelopmentMode) {
    process.env.GOOGLE_APPLICATION_CREDENTIALS = './xxx.secret.json'
}

// Implement "sendLogToGcpLogging" for Server to "send log to GCP"
async function sendLogToGcpLogging ({
    severity = 'INFO',
    logName = 'frontend-log',
    logData = {}
}) {
    const logging = new Logging()
    const log = logging.log(logName)

    // LogEntry Ref: https://cloud.google.com/logging/docs/reference/v2/rest/v2/LogEntry
    const metadata = {
        resource: { type: 'global' },
        severity
    }
    const data = {
        site: 'xxx',
        appVersion: process.env.npm_package_version,
        ...logData
    }
    const entry = log.entry(metadata, data)

    async function writeLog () {
        await log.write(entry)
    }
    writeLog()
}

// ...(omitted)

(async () => {
    await app.prepare()
    const server = express()

    // ...(omitted)

    // Implement "/api/log" for Client side to "send log to Server"
    server.post('/api/log', jsonParser, async (req, res) => {
        if (isDevelopmentMode) {
            // For development mode, will not actually send log to GCP by default
            return res.status(201).json({
                success: 'Log entry send successfully on development mode.'
            })
        }
        try {
            if (!req.body) {
                return res.status(400).json({
                    error: 'Invalid req body.'
                })
            }
            const errorObject = req.body
            // Trigger "sendLogToGcpLogging"
            await sendLogToGcpLogging({
                severity: errorObject.severity,
                logName: errorObject.logName,
                logData: errorObject.logData
            })
            return res.status(201).json({
                success: 'Log entry created successfully.'
            })
        } catch (error) {
            console.error('Error logging:', error)
            return res.status(500).json({
                error: 'Internal server error.'
            })
        }
    })

    // ...(omitted)
})()
After completing the first step, "encapsulating the method for sending logs," we proceed to the second step, "catching errors and sending logs." Basically, at the point where errors occur, you organize all the data you want to record and call /api/log. For the ErrorBoundary example, it's handled in componentDidCatch(error){...}, as follows:
/* ErrorBoundary.js file */
import ErrorFallback from './ErrorFallback'
import { connect } from 'react-redux'
import { ENVIRONMENT } from '@/config'
import { unAuthPost } from '@/lib/api/request'
import { checkIsClientSide, getDeviceInfo } from '@/lib/general/window'

class ErrorBoundary extends React.Component {
    constructor(props) {
        super(props);
        this.state = {
            hasError: false,
            error: null
        };
    }

    static getDerivedStateFromError(error) {
        return { hasError: true, error };
    }
    // Catch error and send log to `/api/log`
    componentDidCatch (error) {
        if (checkIsClientSide()) {
            const deviceInfo = getDeviceInfo()
            const userInfo = this.props.user
            unAuthPost(
                '/api/log',
                {
                    severity: 'CRITICAL',
                    logData: {
                        message: `${ENVIRONMENT} Unexpected Page Crash Error`,
                        pathName: window.location.pathname,
                        title: error.message,
                        stack: error.stack,
                        userId: userInfo.id,
                        companyId: userInfo.currentCompanyDetail.id,
                        deviceOS: deviceInfo?.os?.name,
                        deviceType: deviceInfo?.device?.type,
                        browserName: deviceInfo?.client?.name,
                        browserVersion: deviceInfo?.client?.version,
                        ......
                    }
                }
            )
        }
    }

    render () {
        if (this.state.hasError) {
            return (
                <ErrorFallback
                    error={this.state.error}
                    resetError={() => {
                        this.setState({
                            hasError: false,
                            error: null
                        });
                    }}
                />
            )
        }
        return this.props.children
    }
}

const mapStateToProps = (state) => {
    return { user: state.user }
}

export default connect(mapStateToProps, null)(ErrorBoundary)
How to call the API to send data depends on your project's implementation. Each project will have differences.
After success, you'll see data like the following in the GCP Logging Console:
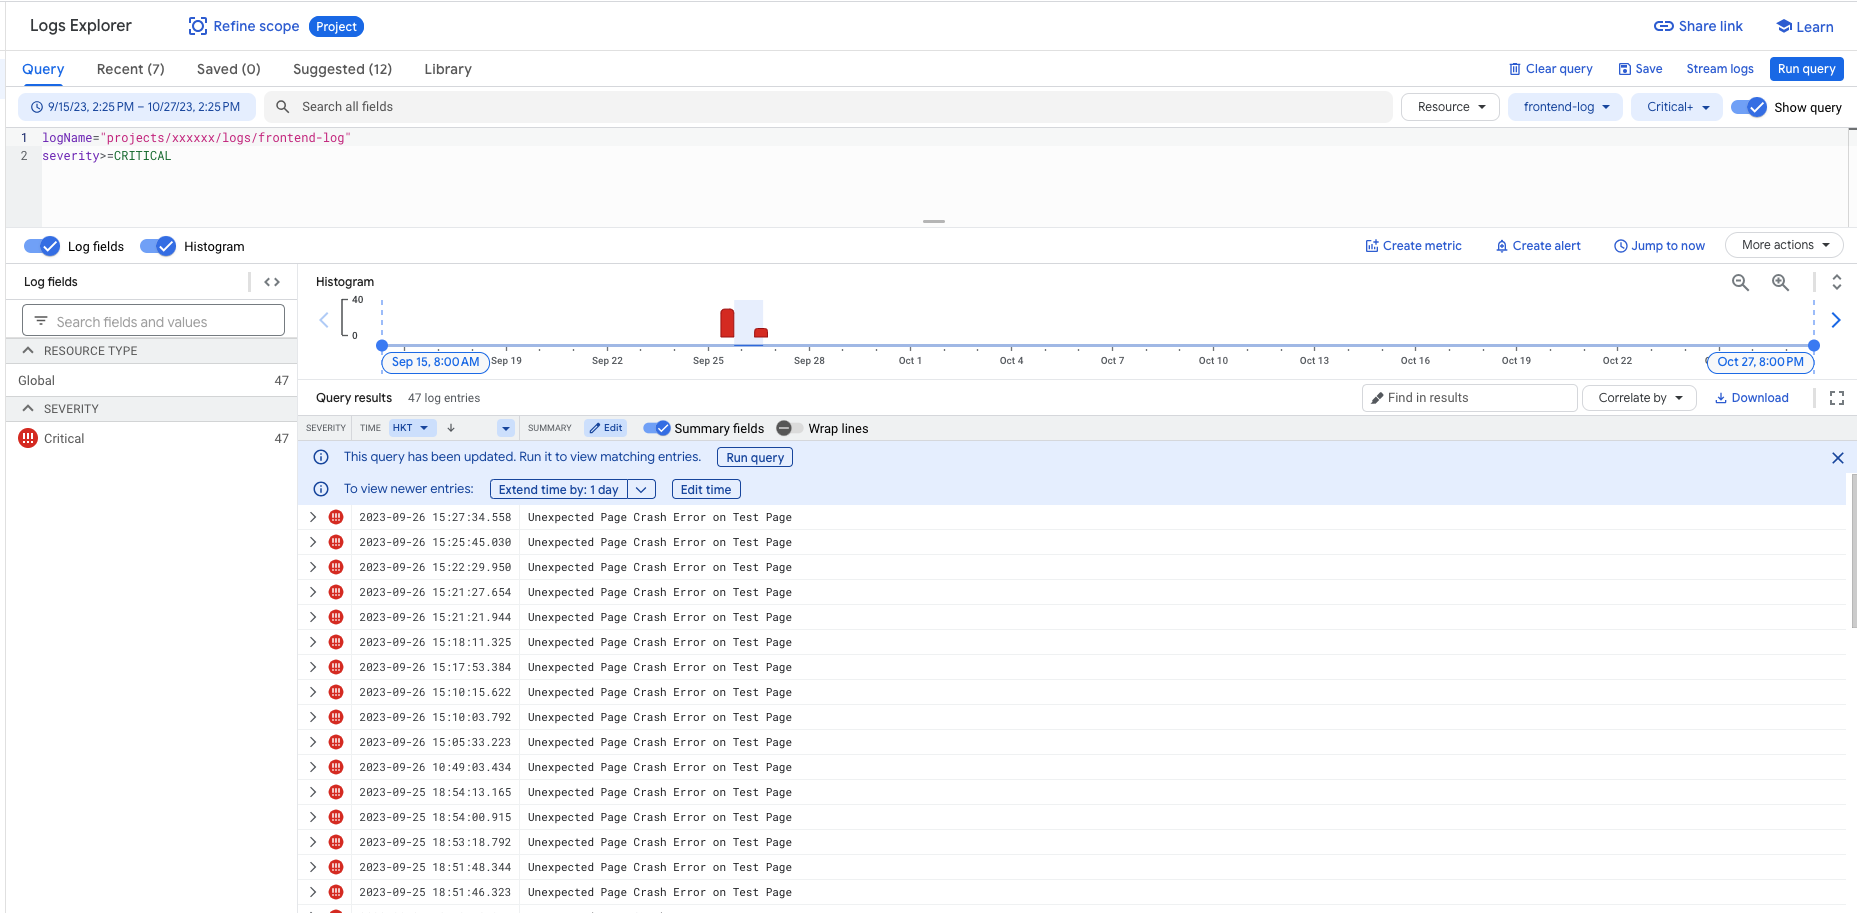 (GCP Logging Console illustration)
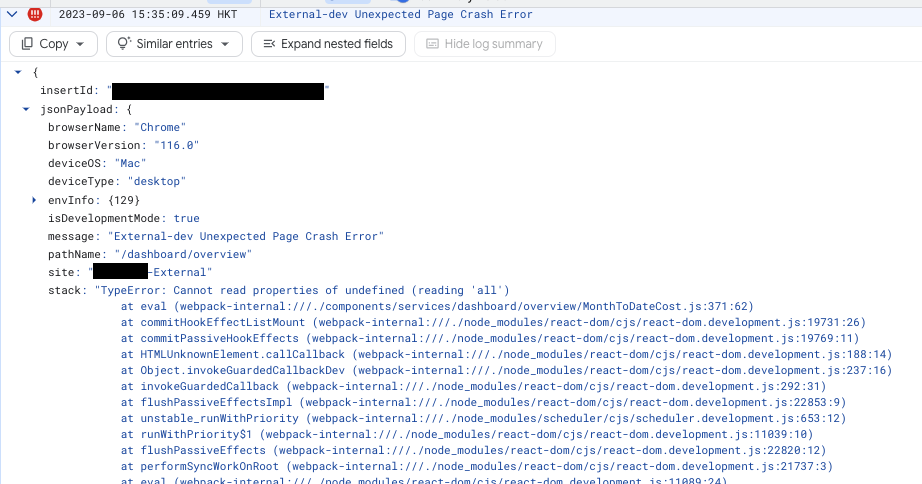
 (Expanded view of a single log entry)
In the implementation method described above, special attention needs to be paid to "whether the frontend Server will be overwhelmed if a large number of errors occur and the /api/log API is called repeatedly." The product we implemented at the time was evaluated based on its nature and resource allocation, and the probability of the Server being overwhelmed was deemed extremely low. But for other products, such as those with extremely high traffic, many additional details would need to be handled.
In short, remember to evaluate your product's situation before deciding how to implement, so that benefits can be maximized.
Monitoring Level Processing
Concept Introduction
Finally, we come to the last component, error monitoring, or more specifically error alerts.
At this level, the goal is to transform passive reactions into proactive responses, allowing teams to discover and handle errors without user reports. This has several benefits:
- Issues are fixed before users discover them, so users experience no problems at all
- Repairs begin before users discover issues, so when they do, the fix seems fast
- Product managers know about errors in advance and can prepare responses to inquiries from management or users
- And more...
SLA (Service-Level Agreement) is an important metric here. SLA refers to the quality of service guarantee provided to customers. For example, if a product guarantees customers an SLA of 99.5%, it means the product service is expected to be available 99.5% of the time in a year, which allows for approximately 1.83 days (43.8 hours) of downtime per year, whether planned or unexpected.
So how quickly issues can be fixed becomes a critical factor. Good error monitoring helps achieve SLA targets more smoothly.
I believe the most important point in setting up error monitoring alerts is: establish meaningful error alerts.
What are meaningful error alerts? They are "alerts that require action." If no one looks at or needs to act on an error alert every time it appears, then the alert is meaningless.
For example: if you want to set up "error alerts when APIs have errors," do you need an alert when a user enters an incorrect account during login and the API reports an error?
No, because users frequently input errors, but this is "normal behavior." You can record an error log each time for later queries if needed, but you don't need to send an alert notification to developers every time a user enters an incorrect account, because developers don't actually need to do anything.
Of course, if there are consecutive "abnormal behaviors," such as 100 consecutive failed login API calls within a minute, do you need an error alert?
Yes, but this would be a different alert from the "API error alert" mentioned above. You would set up a "DDoS error alert" or "API error frequency too high alert." Categorizing error alerts well is important so that developers immediately know what issue has occurred when they see an alert and can take action.
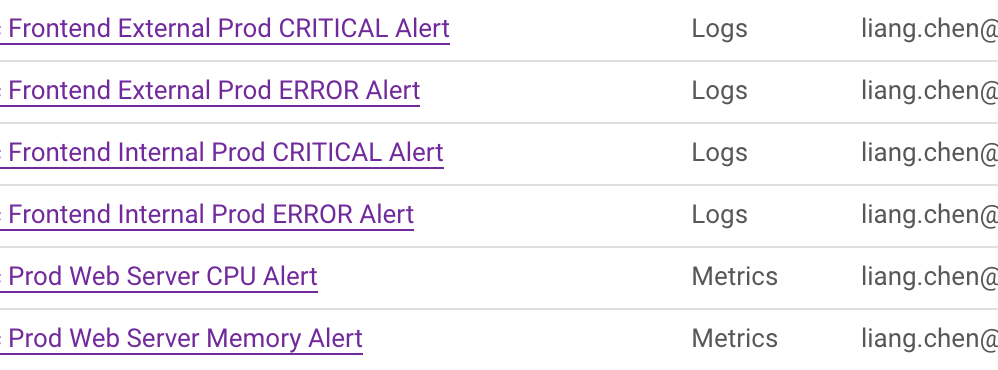 (Alert Policy example, different policies set up for different sites and error types)
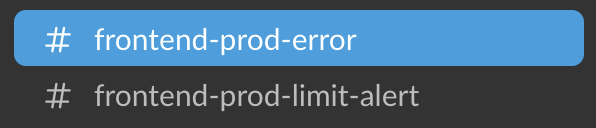 (Slack Channel example, notifications can be appropriately categorized to quickly identify the error type)
Error monitoring and alerts are also processes that can be continuously improved. If you discover an important error that wasn't alerted, set up a new alert for next time; if there are alerts that consistently give false alarms, disable them next time.
When error monitoring is set up properly, the general problem-handling process is:
- An error notification appears in Slack (see image below) =>
- The error log is examined to determine the problem =>
- The issue is reported to a group that includes both product managers and engineers to determine if it needs immediate fixing =>
- If immediate fixing is needed, apply a hotfix; if not, schedule it for the next sprint =>
- Discuss why the problem occurred and how to avoid it in the future
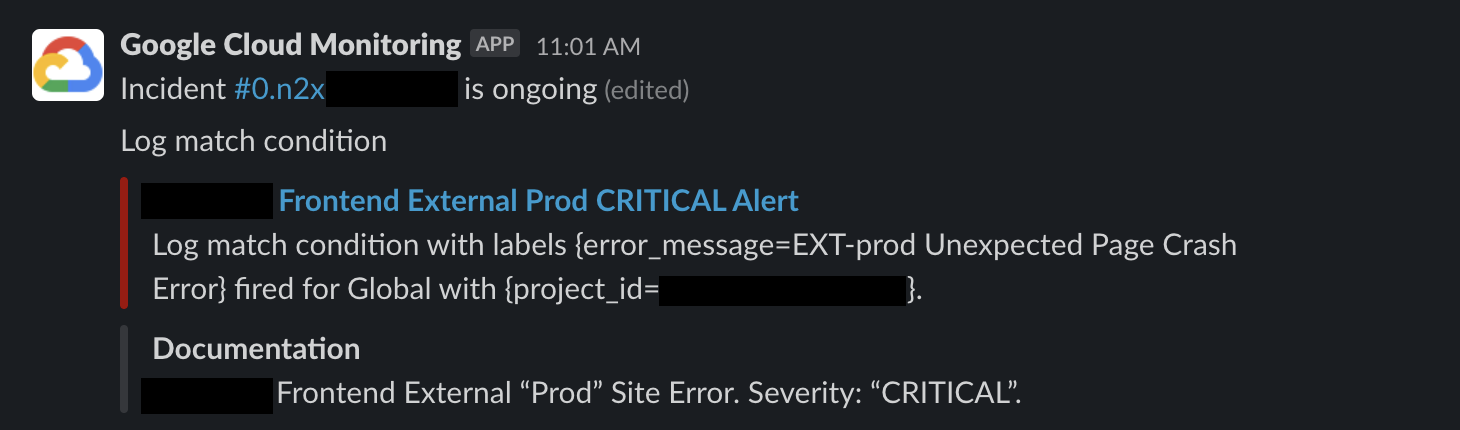 (Slack GCP Alert example, showing a "CRITICAL" severe error that needs immediate handling)
Implementation Summary
Implementation depends on which "monitoring system" and "notification system" you're using. Here I'll demonstrate with GCP Monitoring and Slack.
The reason for choosing GCP Monitoring is the same as for GCP Logging: lower financial costs and technical uniformity, which I won't reiterate.
The reason for choosing Slack is its good integration with various apps, which is usually just a few clicks on the interface.
Basically, connecting these two is very convenient, just a few clicks on the GUI, and there are many online documents and resources, so I won't go into too many details here. I'll mainly briefly explain GCP Alert Policy.
First, you need to create an Alert Policy in GCP Monitoring's Alert section, to define "what is the data source," "what are the alert conditions," "what is the alert frequency," etc. Taking the example of setting up "an alert when CRITICAL level errors occur on external (EXT) sites":
- Data source: Logs from GCP Logging
- Alert condition: When a Log contains Severity of "CRITICAL," trigger an alert
- Alert frequency: Once every 5 minutes
- Auto-close frequency: Automatically close after 3 days if the error doesn't reoccur
- Notification channel: Slack #frontend-prod-error Channel
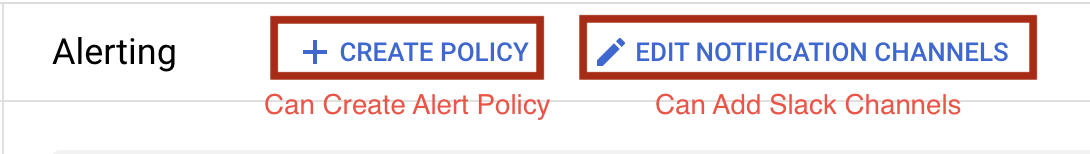 (Creating Alert Policy 1: On the GCP Alert page, you can click Create Policy)
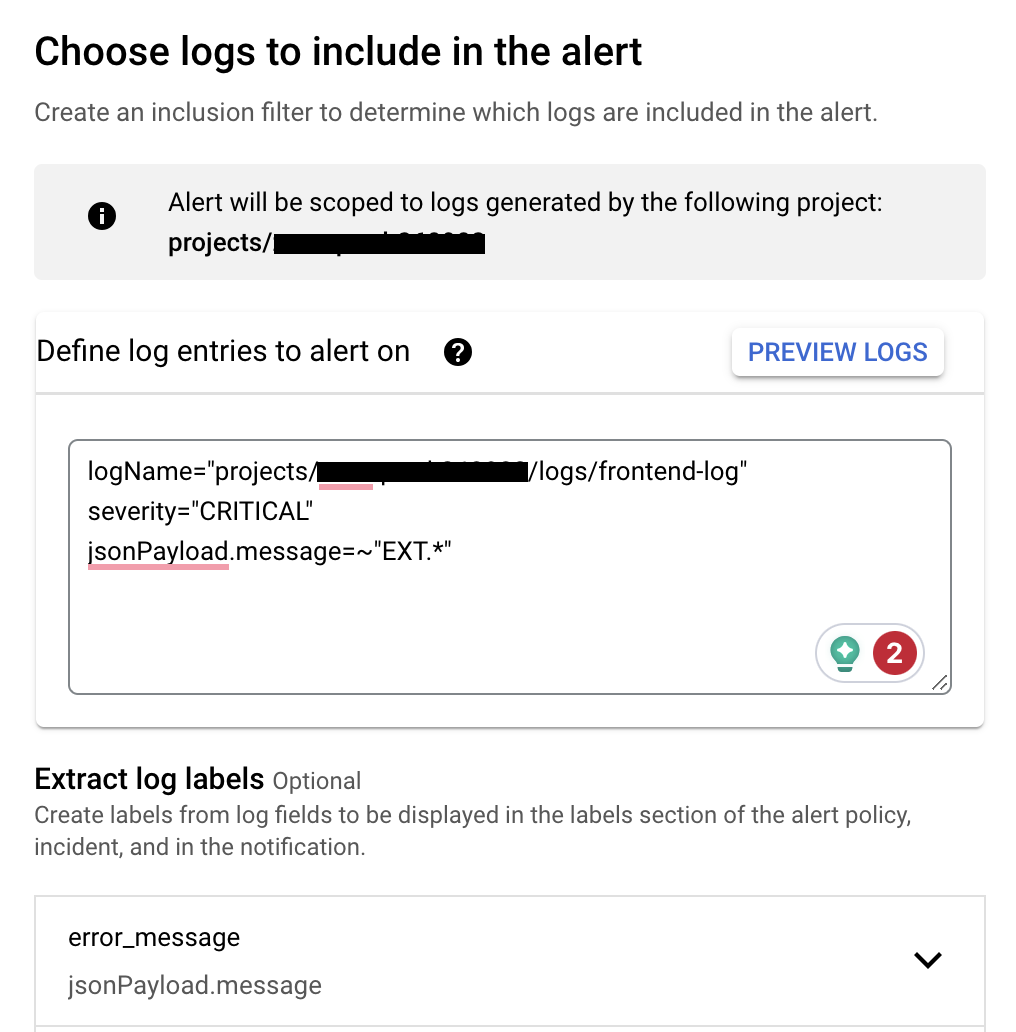 (Creating Alert Policy 2: During creation, you can use Logging query language to filter which Logs should trigger alerts)
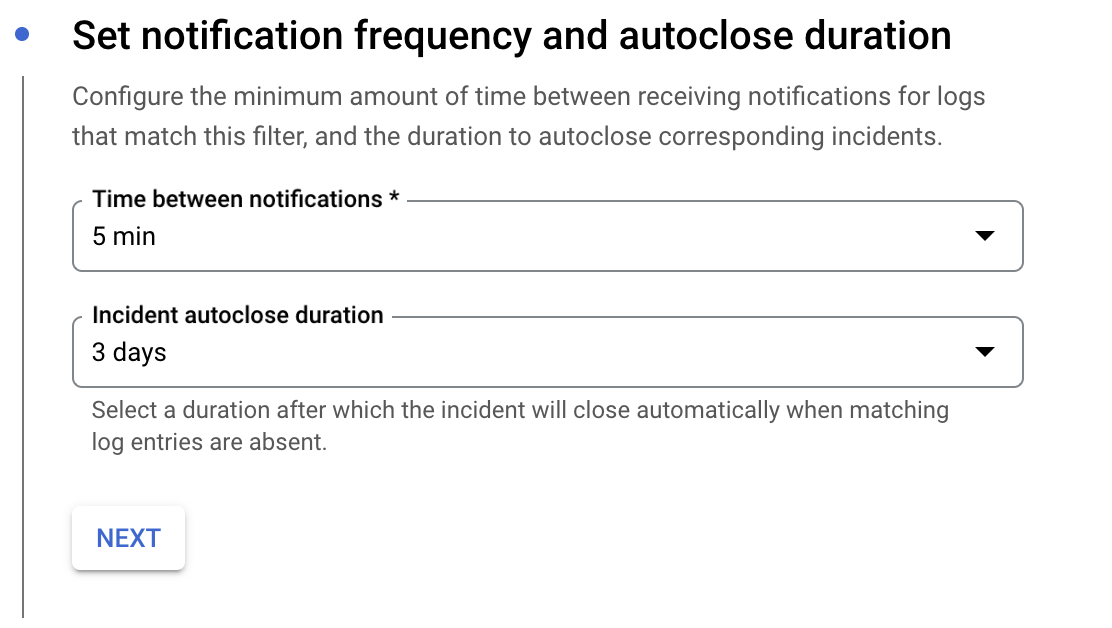 (Creating Alert Policy 3: During creation, you can select alert frequency and auto-close frequency)
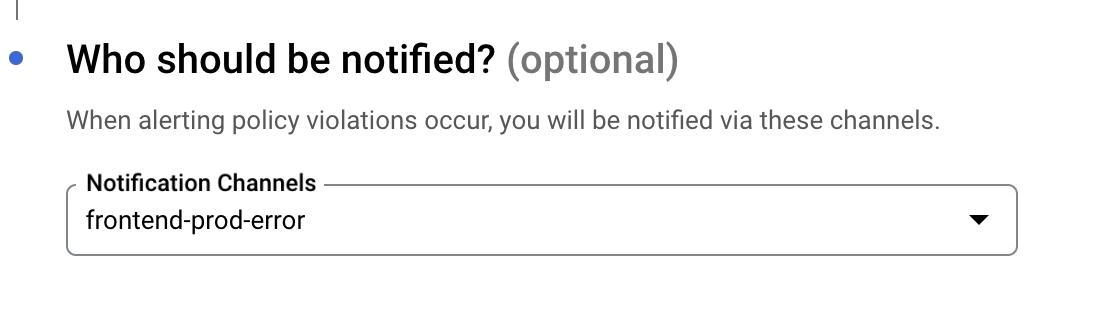 (Creating Alert Policy 4: During creation, you can select which Slack channel to notify)
After filling in all the information, click the create button on the screen to create an Alert Policy. In the future, whenever Logs matching the conditions occur, you'll see alerts in the specified Slack Channel.
If you need more implementation details, you can search for "GCP Monitoring Alert and Slack integration steps" in Chinese or English, or ask ChatGPT4, and you'll find plenty of information.
Key Points and Review
After writing, I realized this article is quite long. If you've read this far, you're very patient. Anyway, by now you should better understand this "Basic Frontend Error System Concept Diagram"!
Here's a bulleted summary of key points:
- The frontend error handling system includes "error displays," "error logging," and "error monitoring."
- When important errors occur, error displays appear to users; error records are stored in Log services; error monitoring triggers alert notifications.
- Error displays:
- Should let users know what happened and what they can still do.
- Should provide developers with preliminary debugging information, at least the error time.
- Error logging:
- Records key data at the moment an error occurs for later queries.
- Must not record information with security concerns.
- Error monitoring:
- Transforms passive reactions into proactive responses, allowing teams to discover and handle errors without user reports.
- Should set up "alerts that require action." If no one looks at an error alert, it's meaningless.
- All error processes can be continuously improved. They don't need to be perfect all at once (and usually can't be). Continuous reflection and optimization are important.
Finally, I'd like to share that after implementing the frontend error system for our product, it truly helped both the product itself and the product managers. Random examples include:
- Some features deployed to Dev/Staging threw intermittent errors, allowing us to fix them before going to Production.
- Some features deployed to Production had a small number of errors "consistently" occurring. After investigation, we found the root cause, fixed it urgently, and resolved it before users reported it.
- Product managers felt that after the frontend error system was implemented, they had a better understanding of the product's current state. Even when there were errors, they could address them earlier and have more confidence in the product.
Additionally, the frontend team also feels more confident when deploying features.
In short, the improved frontend error system truly brought value. I'm documenting and sharing this not only for future reference but also in hopes it might bring value to others.
References
- React Error Boundary
- GCP Logging Doc
- GCP Monitoring Doc
- 網站前端打 API 時把密碼加密,有意義嗎?
- Proofreading assistance from ChatGPT4